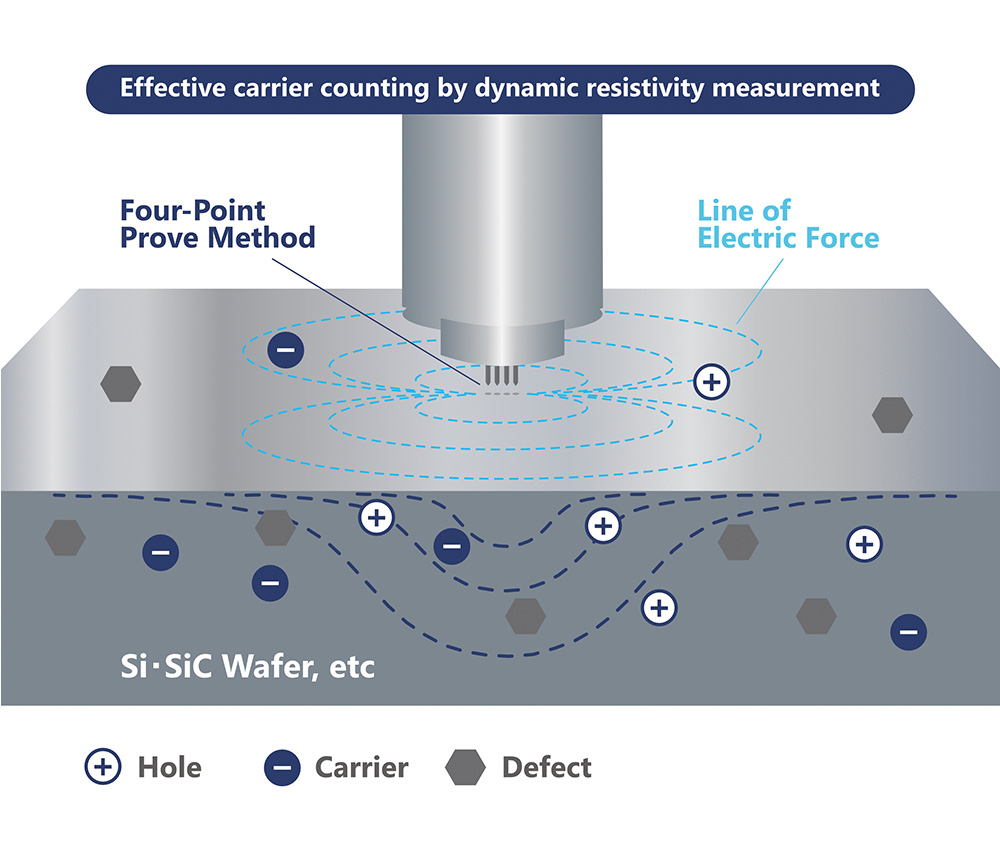
HS-CMR method is a new technology developed by the Institute for Materials Research, Tohoku University that integrates a four-point probe resistivity measurement method with a new theory.
By obtaining the resistivity profile while changing the impressed current at high speed, accurately reflects not only contamination and mechanical damage on the wafer surface, but also the effects of internal crystal defects and impurities, making it possible to evaluate wafer quality comprehensively.
The parameters obtained by the HS-CMR method correlate with the quality after being the device.
Information such as quality factors and resistivity obtained by measurement can also be used to improve crystal growth technology, slicing technology, texturing, and wrapping technology, etc.

In an ideal semiconductor wafer, resistivity measurements at any current value will show the same resistivity. However, actual semiconductor wafers are subject to contamination, impurities, mechanical damage, and crystal defects. These effects cause current dependence on resistivity values.
Wafers have a mixture of pn due to dopants, impurities, and crystal defects, and an accurate representation of quality requires a comprehensive evaluation of the wafer’s surface and internal conditions.
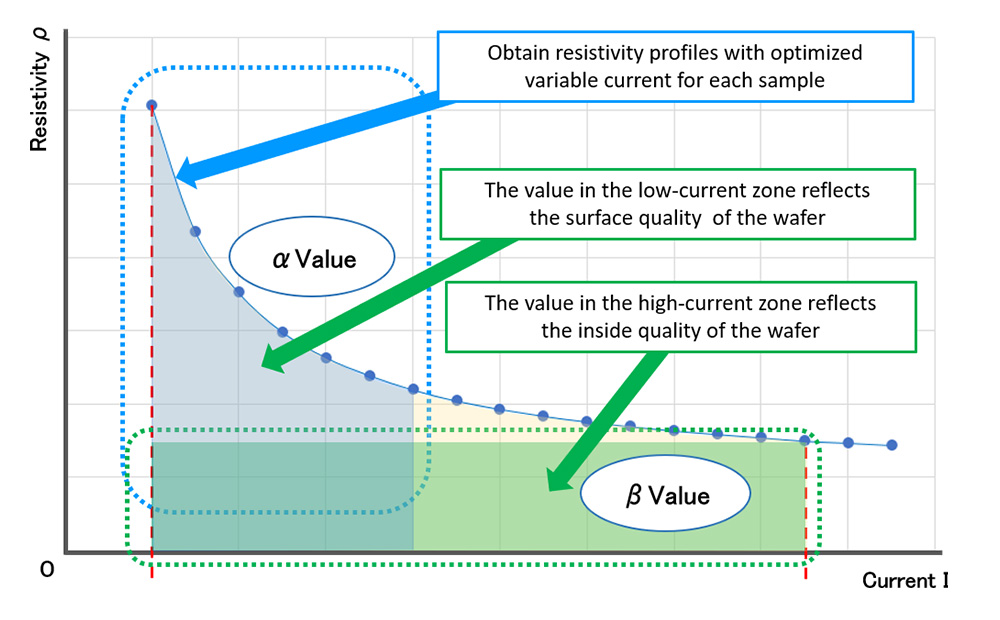
The HS-CMR method applies an optimized variable current for each sample, and by acquiring and analyzing the resistivity profile, it is possible to comprehensively measure the surface and internal of the wafer.

The HS-CMR method measures resistivity while applying a variable current to the wafer.
Then, the curve shown above can be obtained when the vertical axis is resistivity, and the horizontal axis is current value.
Two quality coefficients, α and β values, can be obtained by analyzing this curve.
The α value mainly reflects the quality of the wafer surface, and the β value reflects the internal quality of the wafer.

The resistivity profile by variable current provides a comprehensive indication of a wafer’s surface and internal crystal quality.
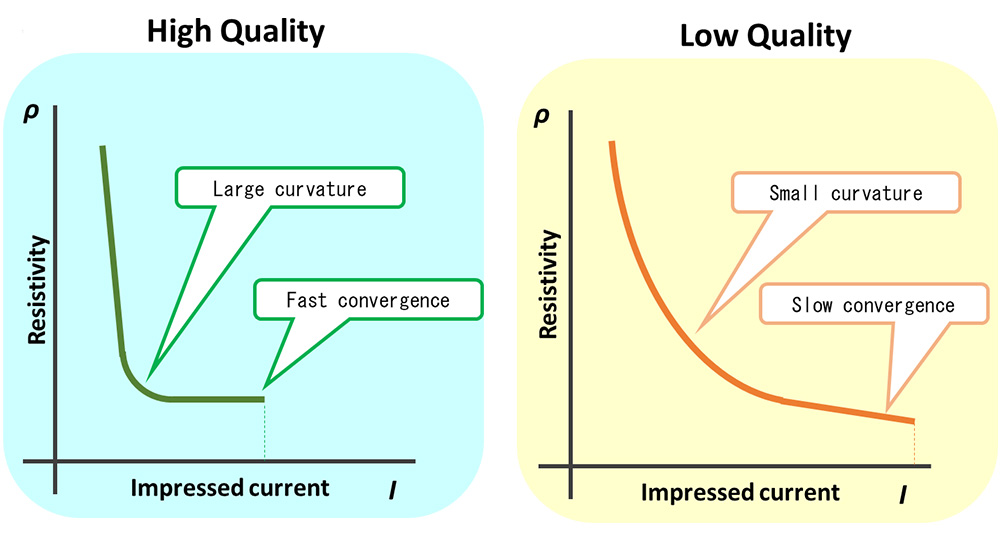
If a wafer is of high quality, the curves shown by the current and resistivity profiles tend to have a greater curvature and stabilize (converge) quickly after dropping to a specific resistivity. In contrast, if the wafer is of low quality, the curvature of the curves shown by the current and resistivity profiles is small, and the resistivity is hard to converge.
The HS-CMR method analyzes this information and evaluates wafer quality using two quality coefficients, α and β values.


For the measurement results, we will provide the current and resistivity profiles that show the state of the entire wafer, as well as the α value that mainly shows the state of the wafer surface and the β value that mainly shows the state of the wafer interior. We can also provide color mapping data of α and β values.